
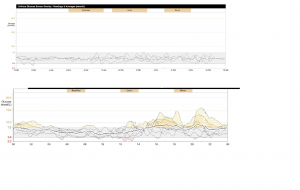
Have you ever wondered what a working pancreas gets up to in a week? Check out the above graphs and take a guess at which one is evidence of diabetes and which one is not.
If you need a bit of guidance about what these graphs show read this paragraph. These graphs are from uploading of a Continuous Glucose Monitor, a device that takes a reading of a persons interstitial Blood glucose (BG) level every 5 minutes through a sensor and a transmitter that is worn for 1 full week. BG level is on the vertical bar and time of day is on the horizontal bar. Each line depicted is one day, these graphs both represent about 6 days. The black dotted line is the average of all of these days, so your average blood glucose level. The two hard lines on the top and bottom which is evidenced better in my husband’s graph are your high and low ‘limits’ which we both had set to 4.0 mmol/L and 8 mmol/L respectively. Areas that are coloured in yellow represent high BG levels and areas in red represent low BG levels. Please don’t hesitate to ask me any questions by commenting!
I posted about this a while ago with a snap shot from one day whilst my husband and I were both on CGM. It’s not like it’s not clear, but, my husband does not have diabetes, he does in fact have a very high performing pancreas in comparison to my slacker pancreas as you can see in the two graphs above, the top one being his.
My husband was using Medtronic’s Guardian Connect and I was using my G2 transmitter that is linked with my 640G Medtronic Insulin Pump; I have been using CGM for about 90% of the time for about 2 years now and I love it. With a now one year old running around and a busy life it makes things a lot easier to manage. I still test my blood glucose levels a lot during the day with my blood glucose machine but this gives me pre warning and reminds me at different times that I may not have known to do the test. It allows me to catch my blood glucose level before either high or low levels when my diabetes is not necessarily the top priority in my day and it allows me to pre-empt wether certain activities are going to be safe or whether I need to check and eat first. Without my Insulin Pump and my Continuous Glucose Monitor I feel my diabetes would be much less controlled at the moment. I can only imagine how many times I would have left the house without my insulin pens if I were still using them. At least my insulin pump is attached to me at all times and I don’t need to think about it in order for it to magically be on me when I need it.
Throughout this week my husband and I were largely eating the same food at the same time and look at the massive difference between graphs! Most days we started off with a pretty similar fasting level but from there it was anyone’s guess what happened with my levels. It seemed that way at least. In the morning we would both start off around 5.4mmol/L, we would have breakfast and when we finished eating breakfast I would look at the graphs again to see his levelling out and happy and see mine on the rise with two up arrows! How frustrating that was. Mine did level out eventually as it normally does but it was funny to see how different the readings are over time with a working pancreas in action.
In order for me to get the graph above I was doing 7 to 14 manual blood glucose readings a day, 3 callibrations, and an average of 15 bolus doses of insulin; my husband was doing 3 blood glucose readings and using these as callibrations, and he was doing no insulin.
Do you use an insulin pump or Continuous Glucose Monitor, or both? Do you find that these have changed your life for the better or worse?